 MyWay
MyWay route data
How much does route optimization save? Real route data by stops and country
How much shorter and faster a route gets when the stops are put in the best order: figures from real routes optimized in MyWay, by number of stops and for the US, the UK, Canada, Australia and seven more countries.
About 32%
shorter routes
About 28%
less driving time
$91
of gas a month: US driver, 10–14 stops, 20 routes
Data: February 2024 – October 2026 · updated November 4, 2026
Short answer: on routes with 5 or more stops, putting the stops in the best order makes the route about 32% shorter and takes about 28% less time on average. Half of all routes end up between 14% and 48% shorter. The more stops, the bigger the saving: about 22% at 5–9 stops, 34% at 10–14 and more than half from 30 stops up. One route saves a few dollars of gas, but over 20 working days a US driver with 10–14 stops saves about $91 of gas and 14 hours. These are figures from real routes optimized in MyWay Route Planner, not estimates.
Where the figures come from. We make MyWay Route Planner. Every time a driver optimizes a route, the app works out two versions of it on the same map: the stops in the order they were entered, and the stops in the optimized order. The figures below compare the two, for routes optimized between February 2024 and October 2026. How we counted is described at the end.
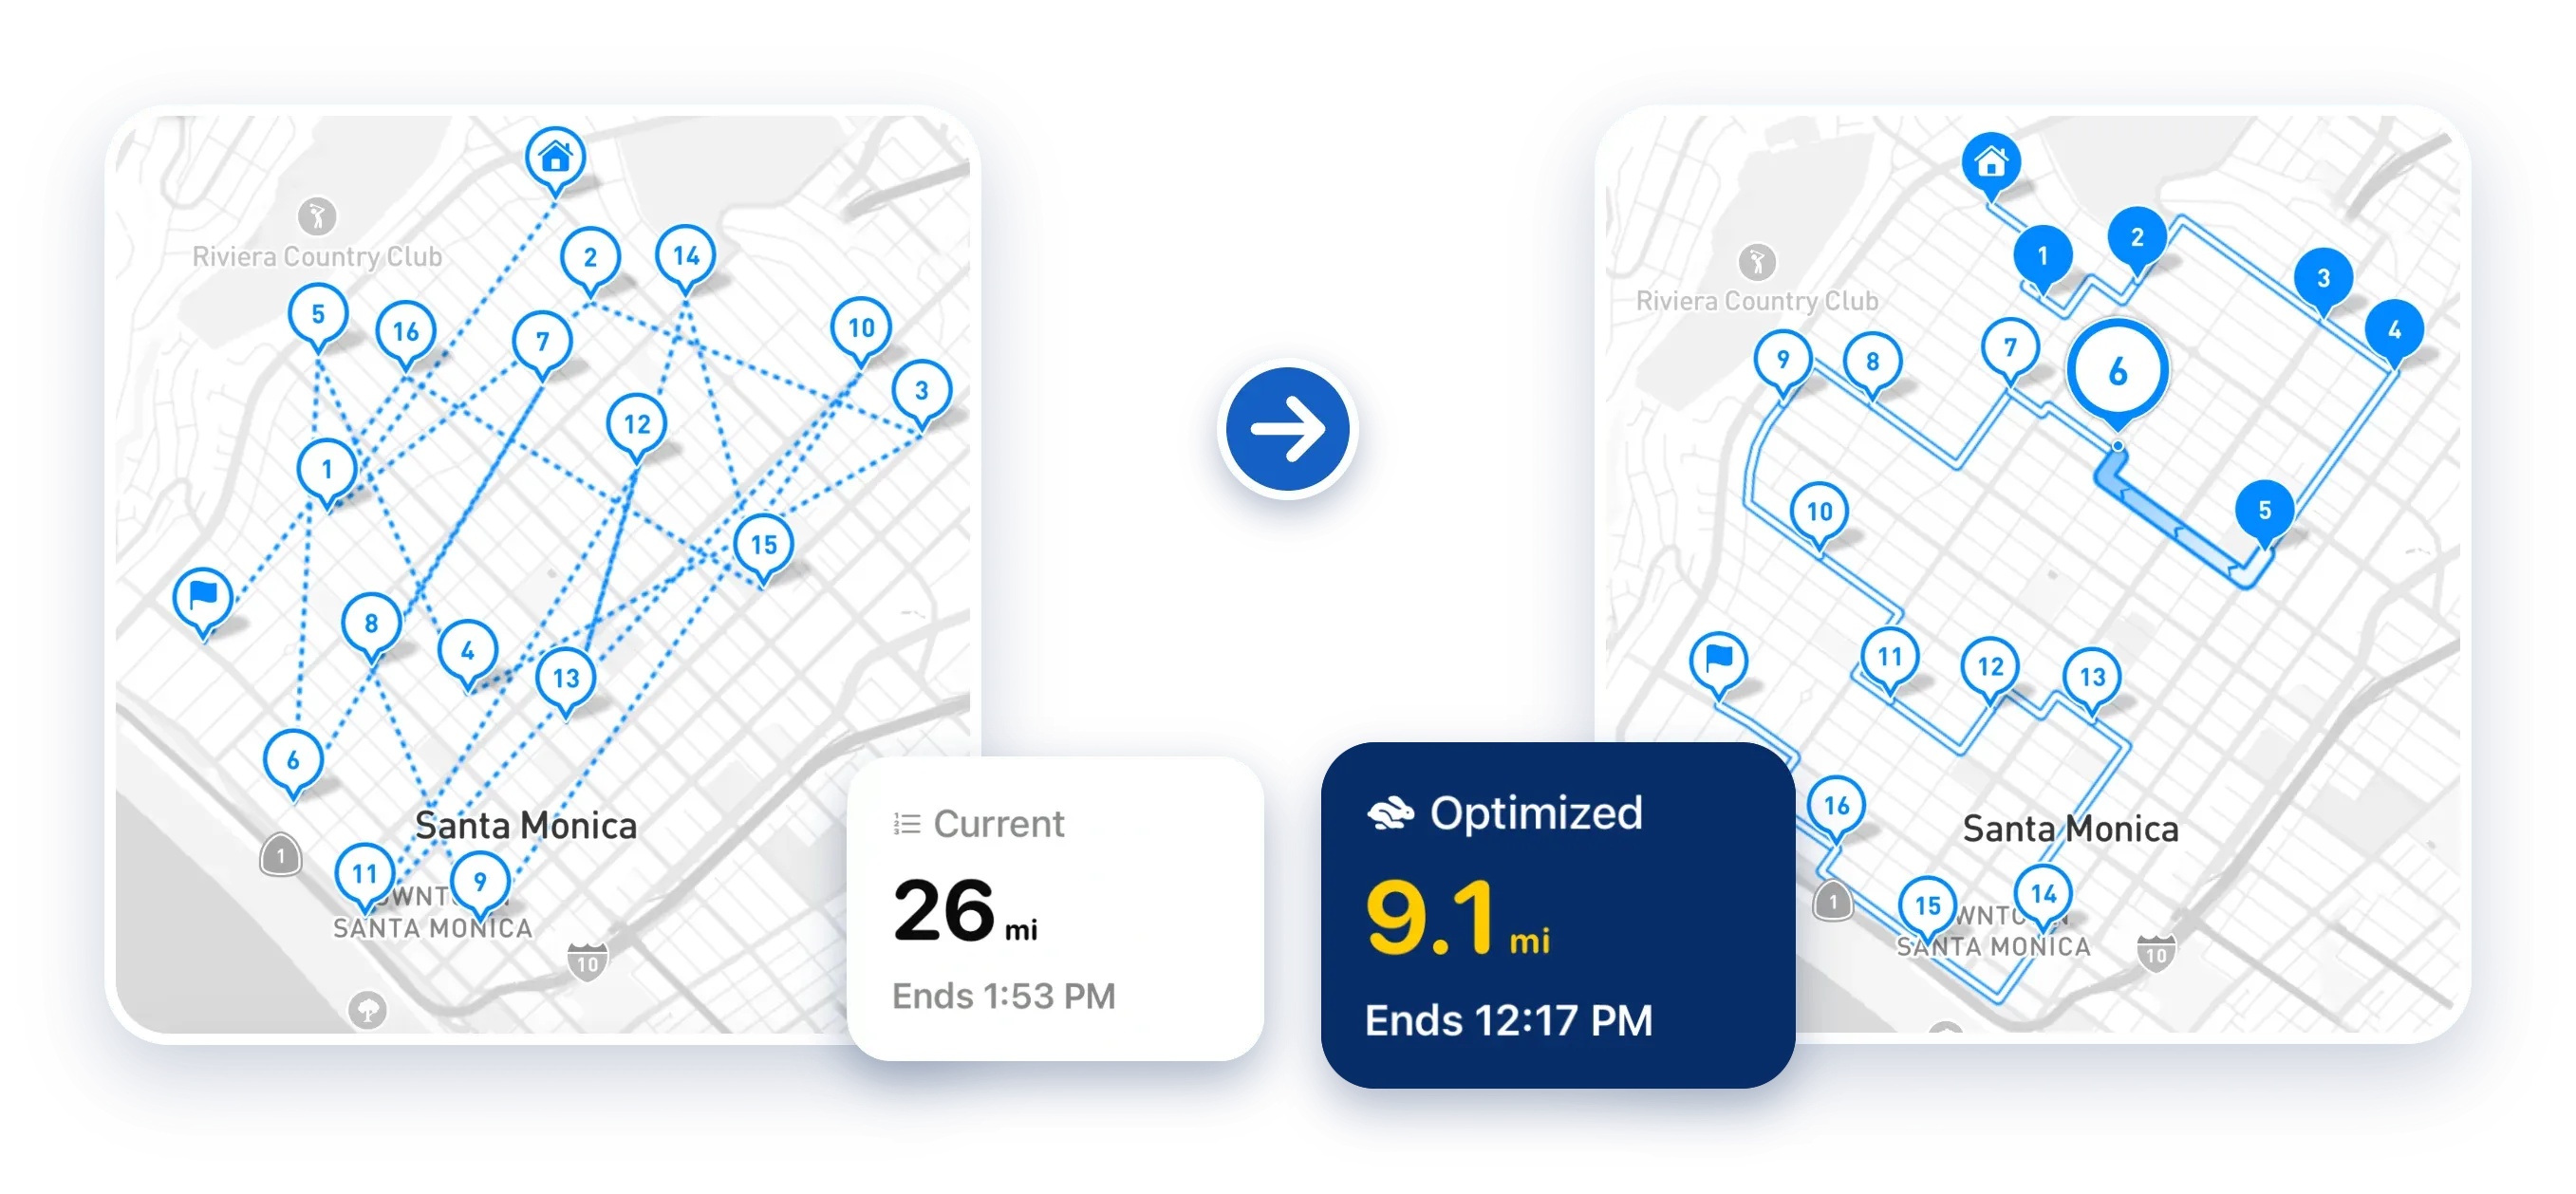
One route in Santa Monica: the stops in the order they were entered (26 mi) and in the optimized order (9.1 mi).
Your route
Routes with 10–14 stops in the USA
Not enough routes from this country with that many stops yet, so these are the figures for all countries.
Shorter by
35% (18–47%)
median (middle half of routes)
Faster by
30% (17–39%)
driving time
Distance saved
26 mi (9–56)
per route
Time saved
43 min (19–80)
per route
Fuel saved: $4.53 a route, $91 over 20 routes, at the latest official price and 10 L/100 km.
Put in your own numbers in the cost per stop calculator.
Savings by number of stops
| Stops on the route | Distance shorter by | Time shorter by | Miles saved | Minutes saved |
|---|---|---|---|---|
| 5–9 | 22% (9–35%) | 20% (9–30%) | 10 mi (3–25) | 19 min (8–40) |
| 10–14 | 34% (17–46%) | 30% (16–40%) | 20 mi (7–47) | 41 min (18–80) |
| 15–19 | 40% (20–53%) | 35% (19–46%) | 27 mi (9–66) | 59 min (25–116) |
| 20–29 | 45% (23–59%) | 40% (21–52%) | 34 mi (12–89) | 83 min (33–166) |
| 30–49 | 52% (27–65%) | 48% (25–59%) | 48 mi (18–114) | 128 min (50–242) |
| 50–99 | 59% (32–72%) | 55% (28–66%) | 73 mi (23–162) | 208 min (69–388) |
The first number in each cell is the median: half of the routes save more, half save less. The range in brackets is the middle half of the routes, from the 25th to the 75th percentile. So a route with 10–14 stops typically gets 34% shorter, which is 20 miles and 41 minutes, and half of such routes save between 7 and 47 miles.
The saving grows with the number of stops because the number of possible orders grows much faster. Five stops can be driven in 120 different orders, fifteen stops in 1.3 trillion, and nobody can compare those in their head (why route optimization is so hard). With two to four stops there are only a few orders to choose from, and the typical route changes by about 1%.
Distance and time are two different savings
The distance saved is what cuts your fuel bill. The time saved is what gives you hours back. They move together, but they are not the same number, so the tables show both.
Almost all drivers optimize for the fastest route, not the shortest one. The planner then looks for the order with the least driving time, and the distance falls along with it. On the same route the distance saving is usually a few points larger than the time saving: 32% against 28% on average.
When you estimate gas, use the distance columns. When you estimate how much earlier you finish, or how many more stops fit into the day, use the time columns. The time you spend at each stop is the same in any order, so the minutes saved are minutes of driving.
Savings by country
Routes with 5 to 99 stops, all stop counts together:
| Country | Distance shorter by | Time shorter by | Distance saved | Minutes saved |
|---|---|---|---|---|
| United States | 30% (13–46%) | 26% (12–39%) | 21 mi (6–55) | 35 min (13–82) |
| United Kingdom | 29% (13–45%) | 26% (12–39%) | 13 mi (4–35) | 33 min (13–79) |
| Canada | 37% (19–54%) | 32% (18–47%) | 33 km (10–93) | 41 min (15–109) |
| Australia | 37% (19–53%) | 34% (18–48%) | 39 km (13–96) | 51 min (18–119) |
| New Zealand | 39% (21–57%) | 36% (20–51%) | 27 km (11–64) | 44 min (18–95) |
| Ireland | 26% (13–41%) | 24% (14–35%) | 27 km (11–61) | 44 min (20–83) |
| Germany | 27% (10–45%) | 25% (11–40%) | 24 km (6–72) | 34 min (12–89) |
| France | 33% (16–49%) | 31% (16–44%) | 21 km (6–71) | 39 min (13–110) |
| Netherlands | 32% (13–49%) | 28% (13–43%) | 25 km (6–74) | 38 min (12–104) |
| Italy | 46% (28–61%) | 43% (27–57%) | 43 km (12–109) | 80 min (27–189) |
| Brazil | 34% (16–50%) | 32% (17–46%) | 17 km (5–43) | 40 min (15–94) |
The percentages are close from country to country: the typical route gets between a quarter and almost half shorter everywhere. The miles and kilometers differ more, because the routes themselves differ. Where stops are far apart, as in the United States, Canada and Australia, the same percentage is worth more distance. In the United Kingdom routes are shorter and denser, so the same percentage saves fewer miles but a similar number of minutes.
United States
| Stops | Distance shorter by | Time shorter by | Miles saved | Minutes saved |
|---|---|---|---|---|
| 5–9 | 22% (9–35%) | 19% (9–29%) | 12 mi (4–29) | 20 min (8–40) |
| 10–14 | 35% (18–47%) | 30% (17–39%) | 26 mi (9–56) | 43 min (19–80) |
| 15–19 | 42% (22–54%) | 36% (20–46%) | 37 mi (13–82) | 66 min (27–121) |
| 20–29 | 46% (19–60%) | 40% (17–51%) | 47 mi (13–114) | 88 min (27–178) |
| 30–49 | 48% (17–65%) | 43% (15–57%) | 56 mi (14–145) | 115 min (30–252) |
| 50–99 | 56% (19–71%) | 50% (16–63%) | 78 mi (15–194) | 186 min (37–388) |
United Kingdom
| Stops | Distance shorter by | Time shorter by | Miles saved | Minutes saved |
|---|---|---|---|---|
| 5–9 | 22% (9–35%) | 19% (9–30%) | 7 mi (2–19) | 18 min (7–40) |
| 10–14 | 32% (15–45%) | 28% (15–39%) | 13 mi (5–34) | 35 min (16–74) |
| 15–19 | 36% (17–50%) | 32% (16–44%) | 17 mi (7–41) | 46 min (22–95) |
| 20–29 | 40% (20–56%) | 36% (18–49%) | 22 mi (10–50) | 66 min (32–124) |
| 30–49 | 46% (28–62%) | 41% (26–56%) | 34 mi (16–66) | 106 min (55–178) |
| 50–99 | 53% (32–67%) | 47% (29–62%) | 59 mi (20–115) | 181 min (69–316) |
Canada
| Stops | Distance shorter by | Time shorter by | Kilometers saved | Minutes saved |
|---|---|---|---|---|
| 5–9 | 26% (13–38%) | 23% (12–32%) | 14 km (5–35) | 18 min (8–36) |
| 10–14 | 37% (22–49%) | 33% (20–42%) | 32 km (12–73) | 42 min (19–78) |
| 15–19 | 43% (24–55%) | 38% (22–48%) | 42 km (15–98) | 57 min (24–113) |
| 20–29 | 48% (28–60%) | 44% (25–54%) | 52 km (21–135) | 77 min (34–158) |
| 30–49 | 55% (37–67%) | 51% (33–61%) | 100 km (38–247) | 143 min (65–281) |
| 50–99 | 64% (40–74%) | 61% (38–69%) | 163 km (64–380) | 248 min (106–485) |
Australia
| Stops | Distance shorter by | Time shorter by | Kilometers saved | Minutes saved |
|---|---|---|---|---|
| 5–9 | 23% (10–36%) | 21% (10–32%) | 16 km (5–39) | 20 min (8–43) |
| 10–14 | 35% (18–47%) | 31% (18–42%) | 36 km (12–83) | 45 min (19–91) |
| 15–19 | 39% (22–52%) | 36% (21–47%) | 39 km (16–96) | 53 min (26–112) |
| 20–29 | 46% (30–58%) | 42% (28–52%) | 51 km (24–114) | 74 min (40–141) |
| 30–49 | 55% (41–64%) | 51% (40–59%) | 86 km (46–155) | 128 min (76–200) |
| 50–99 | 61% (48–71%) | 58% (46–67%) | 135 km (77–235) | 222 min (139–338) |
What the saved distance is worth in fuel
The median distance saved on one route, turned into fuel at 23.5 mpg (10 liters per 100 km) and the latest official price in each country:
| Stops | United States | United Kingdom | Canada | Australia |
|---|---|---|---|---|
| 5–9 | $2.20 | £1.94 | CA$2.51 | A$3.61 |
| 10–14 | $4.53 | £3.57 | CA$5.84 | A$8.36 |
| 15–19 | $6.56 | £4.59 | CA$7.78 | A$9.04 |
| 20–29 | $8.31 | £6.19 | CA$9.62 | A$11.90 |
| 30–49 | $9.83 | £9.42 | CA$18.48 | A$19.97 |
| 50–99 | $13.70 | £16.37 | CA$30.08 | A$31.37 |
Official fuel prices: United States 2 November 2026, United Kingdom 2 November 2026, Canada September 2026, Australia 4 November 2026.
The same for five more countries, from their own routes and at their own official price:
| Stops | Germany | France | Netherlands | Italy | Brazil |
|---|---|---|---|---|---|
| 5–9 | €2.24 | €1.71 | €2.53 | €1.87 | R$5.87 |
| 10–14 | €4.91 | €3.65 | €5.14 | €4.86 | R$12.26 |
| 15–19 | €7.16 | €4.38 | €6.33 | €7.11 | R$16.28 |
| 20–29 | €10.93 | €8.52 | €10.84 | €13.67 | R$16.48 |
| 30–49 | €17.74 | €17.50 | €13.00 | €16.83 | R$21.55 |
| 50–99 | €20.13 | €26.33 | €13.00 | €29.64 | R$33.11 |
Official fuel prices: Germany 2 November 2026, France 2 November 2026, Netherlands 2 November 2026, Italy 2 November 2026, Brazil week of 25 October 2026.
A US route with 10–14 stops saves $4.53 of gas each time it is optimized, so a $9.99 monthly plan is paid back by the third route.
One route looks small. A month doesn't
Five dollars of gas may not sound like much. But nobody drives one route. How many routes you drive in a month matters as much as how many stops are on each of them. At one route a working day, 20 days a month, the saving from the table above becomes:
| Stops | United States | United Kingdom | Canada | Australia |
|---|---|---|---|---|
| 5–9 | $44 | £39 | CA$50 | A$72 |
| 10–14 | $91 | £71 | CA$117 | A$167 |
| 15–19 | $131 | £92 | CA$156 | A$181 |
| 20–29 | $166 | £124 | CA$192 | A$238 |
| 30–49 | $197 | £188 | CA$370 | A$399 |
| 50–99 | $274 | £327 | CA$602 | A$627 |
Official fuel prices: United States 2 November 2026, United Kingdom 2 November 2026, Canada September 2026, Australia 4 November 2026.
| Stops | Germany | France | Netherlands | Italy | Brazil |
|---|---|---|---|---|---|
| 5–9 | €45 | €34 | €51 | €37 | R$117 |
| 10–14 | €98 | €73 | €103 | €97 | R$245 |
| 15–19 | €143 | €88 | €127 | €142 | R$326 |
| 20–29 | €219 | €170 | €217 | €273 | R$330 |
| 30–49 | €355 | €350 | €260 | €337 | R$431 |
| 50–99 | €403 | €527 | €260 | €593 | R$662 |
Official fuel prices: Germany 2 November 2026, France 2 November 2026, Netherlands 2 November 2026, Italy 2 November 2026, Brazil week of 25 October 2026.
The distance adds up the same way. The median distance saved per route in each country, times 20, a month:
| Stops | United States | United Kingdom | Canada | Australia |
|---|---|---|---|---|
| 5–9 | 249 mi | 140 mi | 272 km | 310 km |
| 10–14 | 513 mi | 257 mi | 634 km | 718 km |
| 15–19 | 743 mi | 330 mi | 844 km | 777 km |
| 20–29 | 941 mi | 445 mi | 1,044 km | 1,023 km |
| 30–49 | 1,113 mi | 678 mi | 2,005 km | 1,716 km |
| 50–99 | 1,551 mi | 1,177 mi | 3,264 km | 2,696 km |
| Stops | Germany | France | Netherlands | Italy | Brazil |
|---|---|---|---|---|---|
| 5–9 | 210 km | 158 km | 222 km | 187 km | 181 km |
| 10–14 | 461 km | 339 km | 450 km | 486 km | 378 km |
| 15–19 | 673 km | 406 km | 554 km | 711 km | 502 km |
| 20–29 | 1,027 km | 789 km | 949 km | 1,367 km | 509 km |
| 30–49 | 1,668 km | 1,621 km | 1,139 km | 1,682 km | 665 km |
| 50–99 | 1,892 km | 2,440 km | 1,139 km | 2,963 km | 1,022 km |
So does the time. The median minutes saved per route in each country, times 20, come to these hours a month:
| Stops | United States | United Kingdom | Canada | Australia |
|---|---|---|---|---|
| 5–9 | 7 h | 6 h | 6 h | 7 h |
| 10–14 | 14 h | 12 h | 14 h | 15 h |
| 15–19 | 22 h | 15 h | 19 h | 18 h |
| 20–29 | 29 h | 22 h | 26 h | 25 h |
| 30–49 | 38 h | 35 h | 48 h | 43 h |
| 50–99 | 62 h | 60 h | 83 h | 74 h |
| Stops | Germany | France | Netherlands | Italy | Brazil |
|---|---|---|---|---|---|
| 5–9 | 6 h | 5 h | 6 h | 6 h | 7 h |
| 10–14 | 12 h | 11 h | 12 h | 15 h | 15 h |
| 15–19 | 17 h | 14 h | 15 h | 22 h | 21 h |
| 20–29 | 26 h | 31 h | 28 h | 41 h | 25 h |
| 30–49 | 46 h | 57 h | 38 h | 59 h | 35 h |
| 50–99 | 60 h | 95 h | 39 h | 103 h | 57 h |
For a US driver with 10–14 stops that is $91 of gas and about 14 hours a month, against $9.99 for the plan. The hours are usually worth more than the gas (is a route planner app worth it). To put in your own miles, fuel price and pay rate, use our cost per stop calculator. More ways to cut the fuel bill are in how to save gas as a delivery driver.
What the tables leave out: planning and keeping track
The tables count miles and minutes on the road. Two more things come with a route planner, and for many drivers they matter just as much.
Planning stops being a job of its own. You don't sort addresses on a map or guess which end of town to start from. You add the stops by search, by voice, from a pasted list, a spreadsheet or a scan, tap Optimize, and the order is ready. In our data that takes about 4 seconds for a route of up to 25 stops and about 8 seconds for 50 to 100. When a stop is added or dropped during the day, re-optimizing the stops that are left takes the same few seconds.
You always know where the day stands. You mark each stop done or failed as you go. The list shows what is left, the arrival time at every remaining stop and the time you finish. A photo, a signature or a note stays with the stop as proof of delivery, and the finished route exports as a PDF, Excel or CSV report.
Neither of these shows up as a percentage, but both are there on every route, including the ones where the order was already good.
What moves your number
How many stops you have. This is the biggest factor, as the first table shows.
How many routes you drive. Every figure in the tables is for one route. Twenty routes a month is twenty times that.
How your list starts. The figures compare the optimized route with the order the stops were entered in. A list typed in as the orders came in, or imported from a spreadsheet sorted by customer name, gains the most. A round you already drive in a good order gains less, because there is less left to improve.
How far apart your stops are. The same percentage is worth more miles on a spread-out route than on a dense one, as the country tables show.
Time windows. Routes with time windows are not part of these figures. There the planner does a different job: it finds the best order that still reaches every customer inside their window. What it saves you is the planning itself, the time you would spend working that order out by hand.
How we counted
- First optimization only. Drivers often enter ten stops, optimize, add twenty more and optimize again. From the second time on, most of the route is already in order, so only the first optimization of each route is counted.
- Whole routes only. Routes re-optimized on the road, after some stops were already done, are left out.
- No time windows. Routes with time windows are left out, for the reason above.
- 5 to 99 stops. Every group in the tables holds thousands of routes.
- Planned distance and time. Both versions of a route are calculated on the same map with the same settings. These are planned miles and minutes, not miles recorded while driving.
- Country is where the route was optimized.
- Optimization time is the time from the request to the result.
- Aggregate figures. The statistics contain no addresses and no personal details.
Sources
- MyWay Route Planner: aggregate statistics of routes optimized in the app, February 2024 to October 2026, counted as described above. The figures may be quoted with a link to this page (CC BY 4.0).
- Fuel prices: U.S. Energy Information Administration, $4.153 per gallon, 2 November 2026; UK Department for Energy Security and Net Zero, £1.728 per liter, 2 November 2026; Statistics Canada, CA$1.843 per liter, September 2026; Australian Competition and Consumer Commission, A$2.327 per liter, 4 November 2026; European Commission Weekly Oil Bulletin, Euro-super 95, Germany €2.128, France €2.158, the Netherlands €2.284 and Italy €2.001 per liter, 2 November 2026; Brazil’s National Agency of Petroleum, Natural Gas and Biofuels (ANP), regular gasoline, R$6.48 per liter, week of 25 October 2026.
- MyWay Route Planner plans: pricing.